
The release of the latest CPI report today by the U.S. Bureau of Labor Statistics (BLS) has sent ripples through the financial markets. According to the March 2026 data, consumer prices accelerated sharply, largely driven by a historic, record-breaking spike in energy costs.
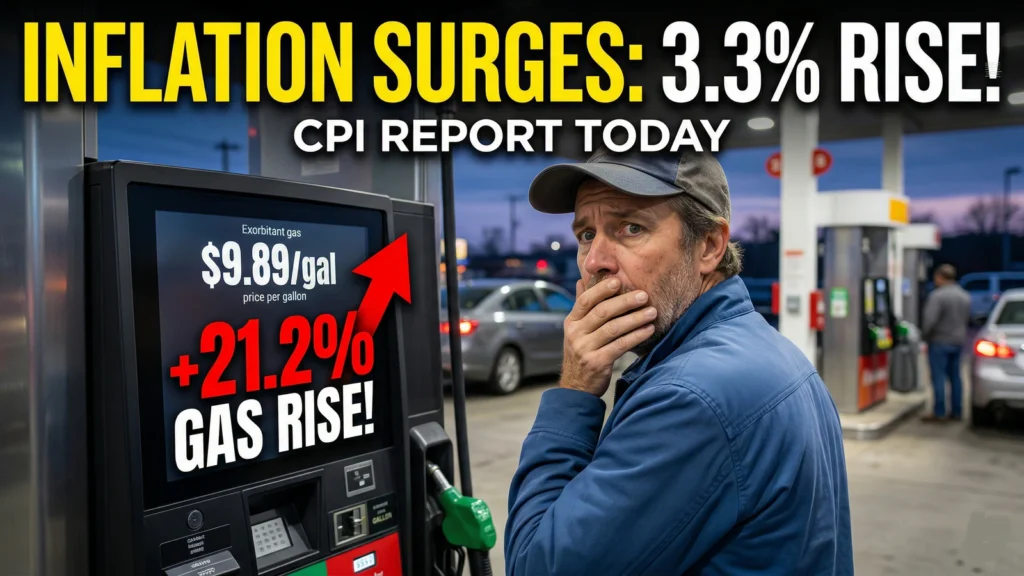
The Consumer Price Index for All Urban Consumers (CPI-U) increased by 0.9 percent on a seasonally adjusted basis in March. This represents a significant jump from the 0.3 percent increase seen in February. Looking at the broader economic picture, this CPI report reveals that over the last 12 months, the all-items index increased by 3.3 percent before seasonal adjustment.
For investors, policymakers, and everyday consumers analyzing this data, the narrative is distinctly two-sided: an aggressive surge at the gas pump is masking what is otherwise a relatively stable core inflation environment.
Key Takeaways from the March 2026 CPI Report
Before diving into the sector-by-sector breakdown, here is the executive summary of what you need to know from this month’s release:
- Headline Inflation: Rose +0.9% month-over-month (MoM) and +3.3% year-over-year (YoY).
- Core Inflation (Less Food & Energy): Remained stable, rising +0.2% MoM and +2.6% YoY.
- Energy Sector: Skyrocketed +10.9% MoM, driven almost entirely by a 21.2% surge in gasoline prices.
- Shelter: Continued its steady climb, rising +0.3% for the month.
- Food Prices: Unchanged at 0.0% MoM, offering consumers brief, much-needed relief at the grocery store.
Valuable Numbers: The CPI Report Data Table
To truly understand the inflationary environment, we must look at the raw numbers. The table below outlines the percent changes across major expenditure categories, providing a clear view of where consumer capital is flowing according to the latest CPI report.
| Expenditure Category | March 2026 (MoM Change) | 12-Month Change (YoY) |
| All Items (Headline CPI) | +0.9% | +3.3% |
| All Items Less Food & Energy (Core) | +0.2% | +2.6% |
| Energy (Total) | +10.9% | +12.5% |
| Gasoline (All types) | +21.2% | +18.9% |
| Fuel Oil | +30.7% | +44.2% |
| Electricity | +0.8% | +4.6% |
| Utility (piped) gas service | -0.9% | +6.4% |
| Food (Total) | 0.0% | +2.7% |
| Food at home (Groceries) | -0.2% | +1.9% |
| Food away from home | +0.2% | +3.8% |
| Shelter | +0.3% | +3.0% |
| Used Cars and Trucks | -0.4% | -3.2% |
| Apparel | +1.0% | +3.4% |
| Airline Fares | +2.7% | +14.9% |
Deep Dive: Energy Prices Dominate the CPI Report
If you are looking for the primary culprit behind the headline jump in this CPI report, look no further than the energy sector. The index for energy surged 10.9 percent in March. To put this in historical context, this is the largest monthly increase recorded in the energy index since September 2005.
Specifically, the gasoline index skyrocketed by an astonishing 21.2 percent over the month. According to the BLS, this is the largest monthly increase in gasoline prices since the series was first published in 1967. Before seasonal adjustments, actual prices at the pump jumped 24.9 percent in March alone. This single metric accounted for nearly three-quarters of the entire monthly increase in the all-items index.
Furthermore, the fuel oil index increased by 30.7 percent over the month, which is its largest monthly increase since February 2000. Conversely, the index for natural gas offered a slight reprieve, decreasing by 0.9 percent.
Core Inflation Trends in the Latest CPI Report
Despite the extreme volatility in the energy sector, “Core CPI”—which strips out volatile food and energy prices to reveal underlying economic trends—tells a much calmer story.
The core CPI report data showed a mild increase of just 0.2 percent in March, which is identical to the reading we saw in February. Over the past 12 months, core inflation has risen by a modest 2.6 percent.
Within the core data, shelter continues to be a major driver. The shelter index increased by 0.3 percent over the month, pushing its 12-month trailing increase to 3.0 percent. The owners’ equivalent rent index and the index for regular rent both increased.
Other notable core movements included:
- Airline fares: Increased 2.7 percent over the month, contributing to a massive 14.9 percent year-over-year gain.
- Apparel: Rose 1.0 percent in March.
- Medical Care: Decreased 0.2 percent in March, driven largely by a 1.5 percent drop in prescription drug prices, though hospital services rose 0.4 percent.
- Used Cars and Trucks: Continued a deflationary trend, dropping 0.4 percent for the month and down 3.2 percent for the year.
Analyzing Food Prices in the CPI Report
Consumers finally found some breathing room at the supermarket. The index for food was entirely flat (0.0 percent) in March, following a 0.4 percent rise in February.
Breaking down the grocery aisle within this CPI report, the “food at home” index actually declined by 0.2 percent. Four of the six major grocery store food group indexes decreased. The index for meats, poultry, fish, and eggs decreased 0.6 percent over the month, heavily influenced by a 3.4 percent plunge in the price of eggs. Cereals, bakery products, and dairy also saw declines of 0.6 percent.
In contrast, the fruits and vegetables index rose 1.0 percent in March. Dining out continues to get more expensive; the “food away from home” index rose 0.2 percent in March, pushing its 12-month increase to 3.8 percent.
Market Implications of Today’s CPI Report
This highly anticipated CPI report presents a complex scenario for the Federal Reserve and institutional investors. While headline inflation jumped to 3.3 percent on the back of historic gasoline price spikes, the Federal Reserve typically focuses its policy decisions on Core CPI to gauge underlying systemic price pressures.
With Core CPI remaining stubbornly stable at 0.2 percent MoM and 2.6 percent YoY, policymakers may view the energy spike as a transitory supply-side shock rather than a broad resurgence of consumer demand inflation. However, sustained high energy costs can eventually bleed into broader goods and services through increased transportation, logistics, and manufacturing costs. Markets will be watching closely to see if these energy spikes begin to push up core metrics in upcoming releases.
Understanding the Technical Details of the CPI Report
To properly analyze this data, it is essential to understand how the Bureau of Labor Statistics compiles the CPI report. The Consumer Price Index measures the change in prices paid by consumers for a representative basket of goods and services.
The CPI-U vs. CPI-W
The headline metric most often cited in the media is the CPI-U (All Urban Consumers), which represents over 90 percent of the total U.S. population. It is based on the expenditures of almost all residents of urban or metropolitan areas, including professionals, the self-employed, the unemployed, and retired people.
The BLS also tracks the CPI-W (Urban Wage Earners and Clerical Workers), which is based on the expenditures of households where more than one-half of the income comes from clerical or wage occupations. In this latest CPI report, the CPI-W increased 3.3 percent over the last 12 months to an index level of 323.500.
Seasonal Adjustments in the CPI Report
For analyzing short-term price trends in the economy, seasonally adjusted changes are preferred. These adjustments eliminate the effect of changes that normally occur at the same time and in about the same magnitude every year—such as price movements resulting from weather events, production cycles, holidays, and back-to-school sales. This allows economists to focus on changes that are not typical for the time of year.
Unadjusted data, on the other hand, is of primary interest to consumers concerned about the actual out-of-pocket prices they pay. Unadjusted data from the CPI report is also used extensively in escalation agreements, collective bargaining contracts, and pension plan adjustments.
Intervention Analysis
Occasionally, extreme values or sharp movements can distort the underlying seasonal pattern of price change. The BLS uses intervention analysis seasonal adjustment (IASA) to estimate and remove these distortions prior to the calculation of seasonal factors. For the seasonal factors introduced for 2026, the BLS adjusted 57 series using this method, including selected food items, motor fuels, and vehicles, ensuring the integrity of the data presented in today’s CPI report.
Upcoming Rebasing Note
An important technical note for financial analysts reviewing this CPI report: With the publication of the April 2026 data on May 12, 2026, several CPI series will be rebased to December 2024 = 100. When new base years are introduced, the BLS recalculates each index back to the beginning of that series to ensure mathematical continuity.
Conclusion
The March 2026 CPI report paints a picture of an economy facing acute energy shocks while broader inflationary pressures simmer at a moderate pace. The 21.2 percent jump in gasoline prices cannot be ignored by consumers, but the stable 0.2 percent core inflation reading suggests that runaway, systemic inflation remains somewhat contained for now. As we look ahead to the spring and summer driving seasons, all eyes will remain on the energy markets to see if this is a temporary spike or a new elevated baseline for American consumers.
Frequently Asked Questions
What was the headline inflation rate in the latest CPI report?
Headline inflation rose 0.9% in March 2026, bringing the year-over-year rate to 3.3%, primarily driven by a historic surge in gasoline prices.
Did the CPI report show an increase in grocery prices?
No, the latest inflation report shows that “food at home” prices actually declined by 0.2% in March, offering consumers temporary relief.
What is “Core CPI” in the inflation data?
Core CPI excludes highly volatile food and energy prices to reveal underlying economic trends; it remained stable at just 0.2% for the month.
How heavily did energy impact today’s CPI data?
Energy prices heavily influenced headline inflation; a record-breaking 21.2% spike in gas prices accounted for nearly three-quarters of the total CPI increase.
Read Full CPI Report for March 2026
The next Consumer Price Index release is scheduled for Tuesday, May 12, 2026.
Read MORE ARTICLES