The Mean Deviation is a fundamental statistical measure used to understand how values in a dataset deviate from the average. Unlike the mean or median, which only summarize central tendency, mean deviation tells us how spread out the data is. This makes it useful not only in academics but also in finance, economics, and business decision-making.
What Is Mean Deviation?
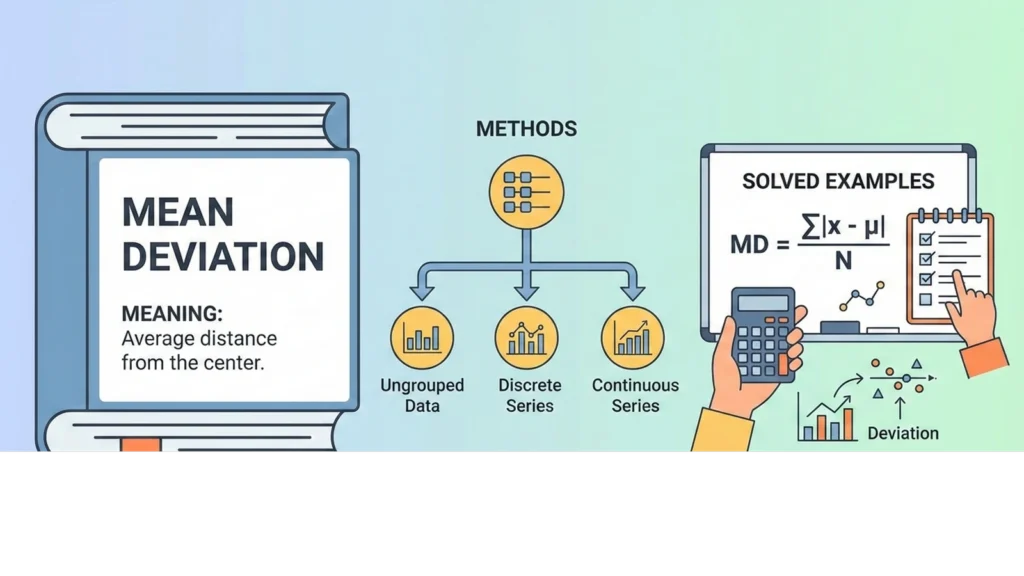
Mean deviation is the average of absolute differences between each data point and a central value (mean, median, or mode). It shows how much, on average, the values deviate from the chosen measure of central tendency.
- Simple Definition: It’s the average distance of all data points from the mean (or median).
- Why It Matters: It helps measure consistency, stability, and risk in datasets.
Formula for Mean Deviation
The general formula is:
Where:
- = each data point
- = average (mean, median, or mode)
- = number of observations
- = absolute deviation of each value from the average
Illustration: Dataset = 5, 10, 15
- Mean = 10
- Deviations = |5-10|=5, |10-10|=0, |15-10|=5
- Sum = 10
- Mean deviation = 10 ÷ 3 = 3.33
When to Use Which Central Value
- Mean: Best for balanced, symmetric datasets without extreme outliers.
- Median: Preferred when data is skewed or has outliers, since it minimizes the effect of extreme values.
- Mode: Useful for categorical or frequency-based data where the most common value is the reference point.
Why Mean Deviation Is Used
Measures Spread/Dispersion
Mean deviation shows how far values are spread out from the average. It tells us whether data points are tightly clustered or widely scattered.
Why Averages Alone Are Not Enough
The mean or median only gives the “center” of data, but two datasets with the same average can have very different variability. Mean deviation adds context by showing consistency or volatility.
Simple Real-Life Examples
- Marks Variation: Two classes may both average 70 marks, but if one class has scores ranging from 40–100, the mean deviation will be higher, showing more inconsistency.
- Incomes: Average income might be $50,000, but mean deviation reveals whether most people earn close to that or if there’s a wide gap.
- Prices: A product’s average price may be $100, but mean deviation shows how much it fluctuates daily—important for buyers and investors.
Methods of Calculating Mean Deviation
1. Mean Deviation About the Mean
- Step 1: Find the mean of the dataset.
- Step 2: Calculate deviations of each value from the mean.
- Step 3: Take absolute values of deviations.
- Step 4: Find the average of these absolute deviations.
2. Mean Deviation About the Median
- Step 1: Arrange data in ascending order.
- Step 2: Find the median.
- Step 3: Calculate absolute deviations from the median.
- Step 4: Average them.
- Note: Mean deviation about the median is often smaller than about the mean, since the median minimizes deviations.
3. Mean Deviation About the Mode
- Step 1: Identify the mode (most frequent value).
- Step 2: Calculate absolute deviations from the mode.
- Step 3: Average them.
- Use Case: Helpful when data is categorical or heavily skewed.
How to Calculate Mean Deviation
Calculating mean deviation is straightforward if you follow a structured process.
Step 1: Find Central Value
Choose the mean, median, or mode depending on your dataset.
Step 2: Find Deviations
Subtract the central value from each data point to get deviations.
Step 3: Take Absolute Values
Ignore negative signs so deviations don’t cancel each other out.
Step 4: Average the Deviations
Add all absolute deviations and divide by the number of observations.
Tabular Illustration
Let’s calculate mean deviation for the dataset: 5, 7, 9
| Data Point | Deviation from Mean (7) | Absolute Deviation |
|---|---|---|
| 5 | 5 – 7 = -2 | 2 |
| 7 | 7 – 7 = 0 | 0 |
| 9 | 9 – 7 = 2 | 2 |
- Sum of absolute deviations = 2 + 0 + 2 = 4
- Mean deviation = 4 ÷ 3 = 1.33
This shows that, on average, the values deviate 1.33 units from the mean.
Watch Video Explanation
Solved Examples
Example 1: Academic Test Scores
Scores: 10, 20, 30, 40, 50
- Mean =
- Deviations: |10-30|=20, |20-30|=10, |30-30|=0, |40-30|=10, |50-30|=20
- Sum of deviations = 60
- Mean deviation =
Result: Mean deviation about the mean = 12
Example 2: Average Age in a Group
Ages: 25, 30, 35, 40
- Mean =
- Deviations: |25-32.5|=7.5, |30-32.5|=2.5, |35-32.5|=2.5, |40-32.5|=7.5
- Sum = 20
- Mean deviation =
Result: Mean deviation = 5 years
Example 3: Financial Case – Stock Prices
Stock prices over 5 days: 100, 105, 110, 95, 90
- Mean =
- Deviations: |100-100|=0, |105-100|=5, |110-100|=10, |95-100|=5, |90-100|=10
- Sum = 30
- Mean deviation =
Result: Mean deviation = 6 (shows average fluctuation from mean price).
Example 4: Business Case – Monthly Sales
Sales (in $000): 50, 55, 60, 65, 70
- Mean = 60
- Deviations: |50-60|=10, |55-60|=5, |60-60|=0, |65-60|=5, |70-60|=10
- Sum = 30
- Mean deviation =
Result: Mean deviation = 6 (sales vary by $6,000 on average).
Mean Deviation vs Standard Deviation
Here’s a simple comparison to highlight the differences between the two measures of dispersion:
| Basis | Mean Deviation | Standard Deviation |
|---|---|---|
| Complexity | Simple to calculate | More complex, involves squaring and square roots |
| Squaring | No squaring, uses absolute values | Yes, deviations are squared before averaging |
| Sensitivity to Extremes | Lower, less affected by outliers | Higher, strongly influenced by extreme values |
| Use in Exams/Studies | Common in basic statistics | Advanced, widely used in research and finance |
Read more about Standard Deviation
Practical InsightsAdvantages and Limitations of Mean Deviation
Advantages
- Simple to understand: Easy to calculate and interpret compared to more complex measures.
- Uses all observations: Every data point contributes to the calculation, making it representative.
- Less affected by extreme values than SD: Since it uses absolute deviations, outliers have a smaller impact compared to squaring in standard deviation.
Limitations
Not as mathematically tractable as SD: It lacks the same theoretical properties that make standard deviation useful in inferential statistics and modeling.
Absolute values complicate algebra: Because signs are removed, it’s harder to use mean deviation in advanced mathematical derivations.
Less used in advanced statistics: Standard deviation and variance are preferred in research and probability theory.
- Academics: Mean deviation helps students understand variability in marks or performance.
- Finance: Investors use mean deviation to measure volatility in stock prices or returns.
- Business: Managers use it to assess consistency in sales, production, or customer demand.
- Economics: Economists apply it to study income inequality or price fluctuations.
Comparisons
- Mean vs Mean Deviation: Mean shows central tendency, mean deviation shows spread.
- Mean Deviation vs Standard Deviation: Standard deviation squares deviations, making it more sensitive to outliers. Mean deviation is simpler and easier to interpret.
- Median vs Mean Deviation: Median often gives smaller mean deviation, useful for skewed data.
Common Mistakes Students Make When Calculating Mean Deviation
- Forgetting absolute values Students often subtract the mean and leave negative signs, which cancel out positives and give wrong results.
- Using wrong central value Sometimes they mistakenly calculate deviations from the wrong measure (mean instead of median, or vice versa).
- Dividing by wrong count Instead of dividing by the total number of observations, some divide by the sum of deviations or another incorrect figure.
- Mixing up with standard deviation Students confuse mean deviation with standard deviation, forgetting that mean deviation uses absolute values while standard deviation squares deviations.
Tips for Using Mean Deviation
- Always use absolute values: Negative deviations must be ignored; otherwise, results cancel out and misrepresent the spread.
- Choose the right central tendency: Use the mean for balanced datasets, the median for skewed data, and the mode for categorical or frequency-based data.
- For skewed data, prefer the median: Mean deviation about the median is more reliable when extreme values distort the mean.
- In finance, use as a quick volatility measure: Mean deviation gives a simple snapshot of how much prices or returns fluctuate before moving to advanced metrics like standard deviation.
Frequently Asked Questions
What is mean deviation in simple words?
It’s the average distance of all data points from the mean or median.
Why use mean deviation instead of standard deviation?
It’s simpler, easier to calculate, and less affected by extreme values.
Can mean deviation be zero?
Yes, if all data points are identical (no variation).
Where is mean deviation used in finance?
To measure average fluctuation in stock prices, returns, or sales data.
Is mean deviation always positive?
Yes, because deviations are taken as absolute values.
Explore MORE ARTICLES