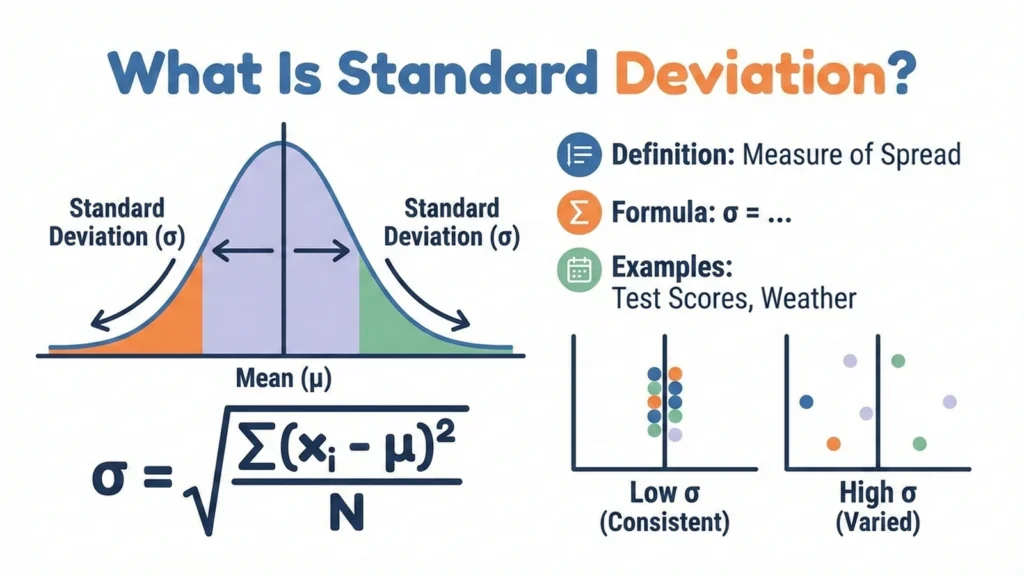
Standard deviation is a way of measuring how consistent or scattered a set of numbers is around the average. If the standard deviation is small, most values are close to the mean. If it’s large, the values are spread out and less predictable.
Why Standard Deviation Matters in Real Life
- Marks: Two students may both average 80 marks, but one scores consistently between 78–82 while the other swings between 60–100. Standard deviation reveals this difference in consistency.
- Income: Average income in a city might be $50,000, but standard deviation shows whether most people earn close to that or if there’s a wide gap between rich and poor.
- Stock Prices: Investors use standard deviation to measure volatility. A stock with high standard deviation fluctuates more, meaning higher risk.
- Consistency: Businesses use it to check stability in sales, production, or customer demand.
One-Liner Example
“Two students have the same average score, but different consistency — standard deviation shows who is more stable.”
What Is Standard Deviation
Standard deviation is a number that tells us how much the values in a dataset vary from the average. If the standard deviation is small, most values are close to the mean. If it’s large, the values are spread out and less predictable.
What “Spread of Data” Means
The “spread” refers to how far data points are scattered around the average:
- Low spread: Values are tightly clustered near the mean.
- High spread: Values are widely scattered, showing more inconsistency.
Small Example Dataset
Let’s compare two sets of exam scores:
- Dataset A: 78, 79, 80, 81, 82
- Mean = 80
- Scores are close to the mean → low standard deviation.
- Dataset B: 60, 70, 80, 90, 100
- Mean = 80
- Scores vary widely → high standard deviation.
Insight: Both datasets have the same average (80), but Dataset A shows consistent performance, while Dataset B shows big swings. Standard deviation captures this difference in spread.
Watch Video Explanation
Formula for Standard Deviation
Standard Deviation Formula (Population vs Sample)
Understanding the formula is key to applying standard deviation correctly. Let’s break it down in simple terms.
Population Standard Deviation Formula
- σ (sigma): Population standard deviation
- xᵢ: Each individual data point
- μ (mu): Population mean (average of all data points)
- N: Total number of data points in the population
This formula is used when you have data for the entire population (e.g., marks of all students in a school).
Sample Standard Deviation Formula
- s: Sample standard deviation
- xᵢ: Each data point in the sample
- : Sample mean
- n: Number of data points in the sample
- n-1: Called the “degrees of freedom,” it adjusts for the fact that a sample is only an estimate of the population.
This formula is used when you only have a sample of the population (e.g., marks of 30 students out of 500).
Explanation of Symbols
- σ (sigma): Standard deviation for the population.
- s: Standard deviation for a sample.
- μ (mu): Mean of the population.
- : Mean of the sample.
- xᵢ: Each observation or data point.
- N / n: Number of observations (population vs sample).
When to Use Population vs Sample
- Population SD: Use when you have complete data for the entire group.
- Sample SD: Use when you only have part of the data and want to estimate variability for the whole population.
Tip
When writing academic or financial reports, it’s good practice to show formulas using MathJax or images so readers can visualize the calculation clearly. For example:
Let’s walk through the process with a simple dataset of 5 numbers: Data = 5, 7, 9, 10, 14
Step 1: Find the Mean
Step 2: Subtract Mean from Each Value (Deviations)
- 5 – 9 = -4
- 7 – 9 = -2
- 9 – 9 = 0
- 10 – 9 = +1
- 14 – 9 = +5
Step 3: Square Deviations
- (-4)² = 16
- (-2)² = 4
- (0)² = 0
- (1)² = 1
- (5)² = 25
Step 4: Find Average of Squared Deviations (Variance)
Step 5: Take Square Root
Final Result
The standard deviation = 3.03. This means that, on average, the values deviate about 3 units from the mean (9).
Solved Examples
Example 1: Small Dataset
Data: 2, 4, 6
- Mean = 4
- Deviations: -2, 0, +2
- Squared deviations: 4, 0, 4
- Variance = (8 ÷ 3) = 2.67
- Standard deviation = √2.67 ≈ 1.63
Example 2: Larger Dataset
Data: 10, 20, 30, 40, 50
- Mean = 30
- Deviations: -20, -10, 0, +10, +20
- Squared deviations: 400, 100, 0, 100, 400
- Variance = (1000 ÷ 5) = 200
- Standard deviation = √200 ≈ 14.14
Example 3: Financial Case – Stock Prices
Stock prices: 100, 105, 110, 95, 90
- Mean = 100
- Deviations: 0, +5, +10, -5, -10
- Squared deviations: 0, 25, 100, 25, 100
- Variance = (250 ÷ 5) = 50
- Standard deviation = √50 ≈ 7.07
Interpretation: The stock fluctuates about 7 points from its average price.
Standard Deviation vs Variance
| Feature | Variance | Standard Deviation |
|---|---|---|
| Unit | Squared units (e.g., marks², rupees²) | Same as the original data (marks, rupees) |
| Easy to Interpret? | No, because squared units are not intuitive | Yes, directly comparable to the data values |
| Common Usage | Used in statistical models, probability theory, and advanced mathematics | Used in reporting, analysis, and practical decision-making |
Why Standard Deviation Is Preferred in Reporting
While variance is mathematically useful, it expresses results in squared units, which are harder to interpret in real-world terms. For example, if exam scores are measured in marks, variance might be 25 marks² — not very intuitive. Standard deviation, however, brings the measure back to the same unit as the data (marks), making it easier to explain and compare. That’s why in finance, education, and business reporting, standard deviation is the preferred measure of variability.
Standard Deviation vs Mean Deviation
| Basis | Mean Deviation | Standard Deviation |
|---|---|---|
| Complexity | Simple to calculate and interpret | More complex, involves squaring and square roots |
| Squaring | No squaring, uses absolute values | Yes, deviations are squared before averaging |
| Sensitivity to Outliers | Lower, less affected by extreme values | Higher, strongly influenced by extreme values |
| Use Cases | Introductory analysis, teaching basics of variability | Advanced statistics, finance, probability theory, research |
Why This Comparison Matters
- Mean Deviation is a beginner-friendly tool: easy to compute, intuitive, and less distorted by outliers.
- Standard deviation is mathematically richer: it connects directly to variance, probability distributions, and advanced statistical models.
- In practice, mean deviation is often used for teaching or quick checks, while standard deviation dominates in professional research, finance, and risk analysis.
Low vs High Standard Deviation
What Low Standard Deviation Means
- Data points are clustered close to the mean.
- Indicates consistency and stability.
- Useful when reliability is important (e.g., consistent exam scores or predictable monthly expenses).
What High Standard Deviation Means
- Data points are widely spread out from the mean.
- Indicates variability and unpredictability.
- Useful when measuring risk or volatility (e.g., fluctuating stock prices).
Real-World Examples
- Exam Scores:
- Class A: Scores range between 78–82 (low SD → consistent performance).
- Class B: Scores range between 50–95 (high SD → big differences among students).
- Monthly Expenses:
- Person A: Spends $20,000 ± $500 every month (low SD → stable spending).
- Person B: Spends anywhere between $10,000 and $40,000 (high SD → unpredictable spending habits).
- Stock Price Volatility:
- Stock X: Moves between $98–102 (low SD → low risk, stable investment).
- Stock Y: Moves between $70–130 (high SD → high risk, volatile investment).
Key Insight
Low standard deviation signals predictability and control, while high standard deviation signals uncertainty and risk. That’s why in academics it highlights consistency, and in finance it becomes a measure of volatility.
Common Mistakes When Calculating Standard Deviation
Even though the formula is straightforward, students and professionals often make errors that lead to incorrect results. Here are the most frequent pitfalls:
- Mixing Sample vs Population Formulas
- Using the population formula when working with a sample (or vice versa) changes the denominator.
- Remember: population divides by N, sample divides by n – 1.
- Forgetting the Square Root
- Many stop at variance (average of squared deviations) and forget to take the square root.
- Variance and standard deviation are related, but only standard deviation is in the same unit as the data.
- Using the Wrong Mean
- If the mean is miscalculated, every deviation will be wrong.
- Always double-check the mean before moving forward.
- Inputting the Wrong Dataset in Calculator/Software
- Entering values incorrectly (e.g., missing a number or duplicating one) leads to distorted results.
- Cross-check the dataset before running calculations in Excel, R, Python, or a calculator.
Quick Tip
A good way to avoid mistakes is to write out each step clearly: mean → deviations → squares → variance → square root. This ensures you don’t skip or mix up parts of the process.
Practical Tips for Using Standard Deviation
Standard deviation is powerful, but it becomes even more useful when applied thoughtfully. Here are some practical tips to guide its use in academics, business, and finance:
- Always distinguish between population and sample formulas
- Use the population formula when you have complete data.
- Use the sample formula when working with a subset, since it adjusts for estimation error.
- Interpret in context, not isolation
- A standard deviation of 10 may be small for incomes measured in thousands but huge for exam scores out of 100.
- Always compare SD relative to the mean or the scale of the dataset.
- Use SD to compare consistency across groups
- Two classes may have the same average score, but the one with lower SD is more consistent.
- In finance, two stocks may have similar average returns, but the one with higher SD is riskier.
- Combine with other measures
- Mean shows central tendency, SD shows spread.
- Together, they give a fuller picture of performance, volatility, or reliability.
- Watch for outliers
- Standard deviation is sensitive to extreme values.
- If your dataset has outliers, consider reporting SD alongside median or interquartile range.
- Use SD in decision-making
- In academics: identify students who deviate significantly from class averages.
- In business: measure consistency in monthly sales or production.
- In finance: assess volatility before investing.
Key Insight
Standard deviation is not just a formula—it’s a lens to understand consistency, risk, and reliability. By applying it carefully, you can move beyond averages and uncover the true behavior of your data.
Conclusion
The Standard Deviation is a cornerstone of statistics and finance. It goes beyond averages to reveal how stable or volatile data is. Whether analyzing exam scores, incomes, or stock prices, standard deviation provides a clear measure of variability. While mean deviation is simpler, standard deviation is more powerful and widely used in advanced analysis.
Frequently Asked Questions
What does a high standard deviation mean?
It means data points are widely spread out from the mean.
Can standard deviation be zero?
Yes, if all data points are identical.
Why square deviations?
To avoid cancellation of positive and negative values and to emphasize extremes.
How is it used in finance?
It measures volatility of returns, helping investors assess risk.
Is standard deviation always positive?
Yes, because it’s derived from squared values.
Explore MORE ARTICLES